Announcing LightningChart for Python 2.2 - Plotting library

We're announcing LightningChart Python 2.2, introducing better UI controls and interaction features for building responsive dashboards. Here are the updates:
New UI elements
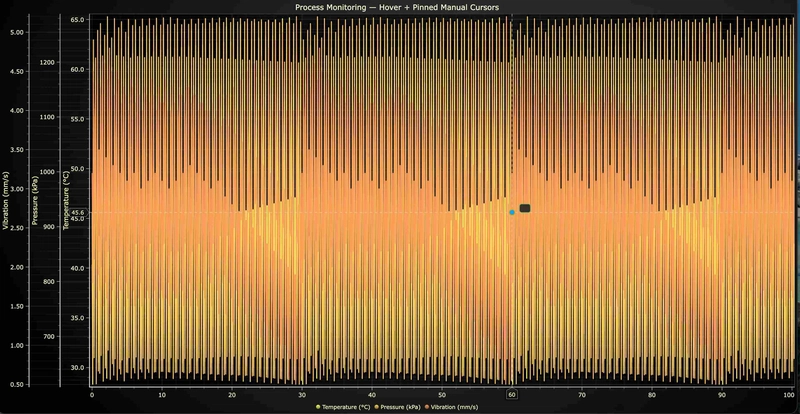
Full cursor customization supporting control behavior, style, and create manual cursors.
Pointable TextBox
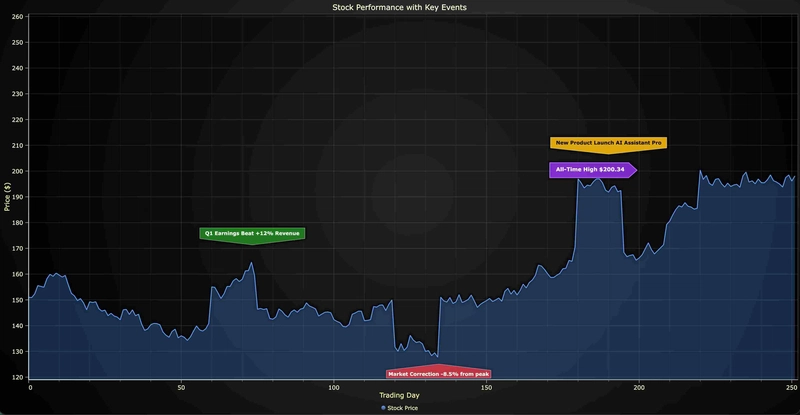
Added interactive callout annotations with built-in directional pointers. PointableTextBox extends the standard TextBox with arrow/pointer functionality, perfect for highlighting specific data points, creating tooltips, or adding explanatory annotations that visually connect to chart elements.
CheckBox Add
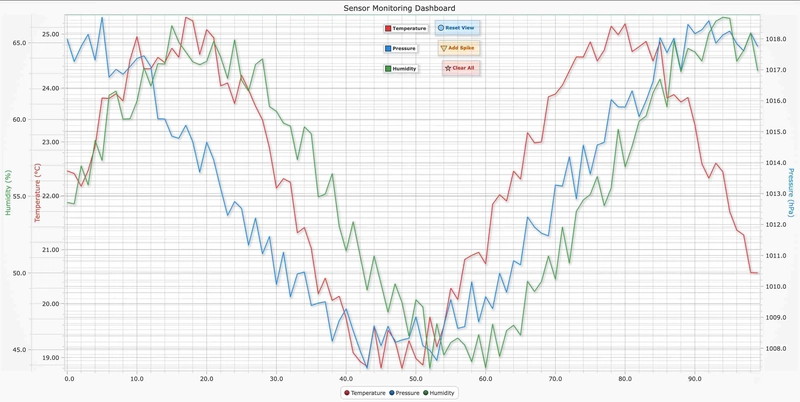
Added persistent, toggleable UI switches directly on charts and dashboards. CheckBox keeps its on/off state after click, supports text, styling, background, and pointer events, and is ideal for options like “Show grid” or “Enable cursor.”
ButtonBox
Added momentary action buttons with automatic bounce‑back behavior. ButtonBox uses the same API and styling as CheckBox, but it resets to “off” after each press. That makes it perfect for one‑shot actions like “Reset view” or “Apply filter.”
Get started
LightningChart Python offers more control, better interactivity, and easier building and managing advanced dashboards.


