JS Charting Application with a UI On-Screen Menu

Hello! This is Omar Urbano from LightningChart. I recently discovered Hashnode and thought: why not share some content about high-performance charting libraries?
In this article, I'll guide you through how to create a JavaScript chart application with an on-screen UI menu using LightningChart JS. An on-screen menu is part of the application's user interface and can be used to simplify the interaction with the graphics/charts.
AboutLightningChart JS
If this is the first time you read about it, LightningChart JS is a JavaScript charting library focused on delivering the highest performance in the world of charting components. LightningChart JS features 2D and 3D components for developing different types of data applications for industries such as medical, engineering, science, motorsports, aerospace and defense, etc.
Project
Even if you're new to data visualization with JS libraries, you will be able to use NodeJS to create the JS on-screen menu application from scratch and run the chart code on it.
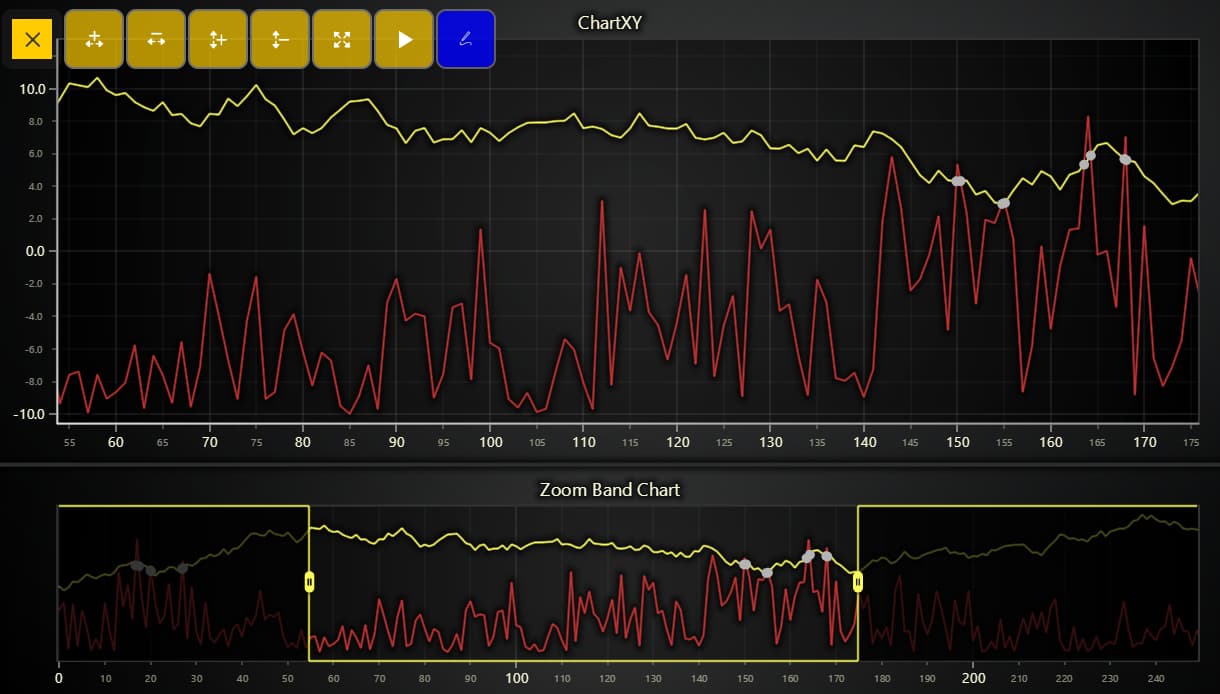
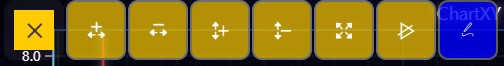
What's interesting about this project, is that the menu floating on the chart application contains several functions that will help the user modify the view of the active chart.
The functions are included in the OnScreenMenuButtonType class and for creating the chart, we will use an XY graph with a two-line series and a zoom graph (the zoom band chart).
Template Setup
To initialize the project, let's set up a working template or you can also download the project template (.ZIP) and follow along the tutorial.
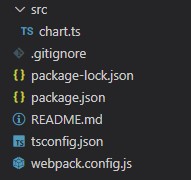
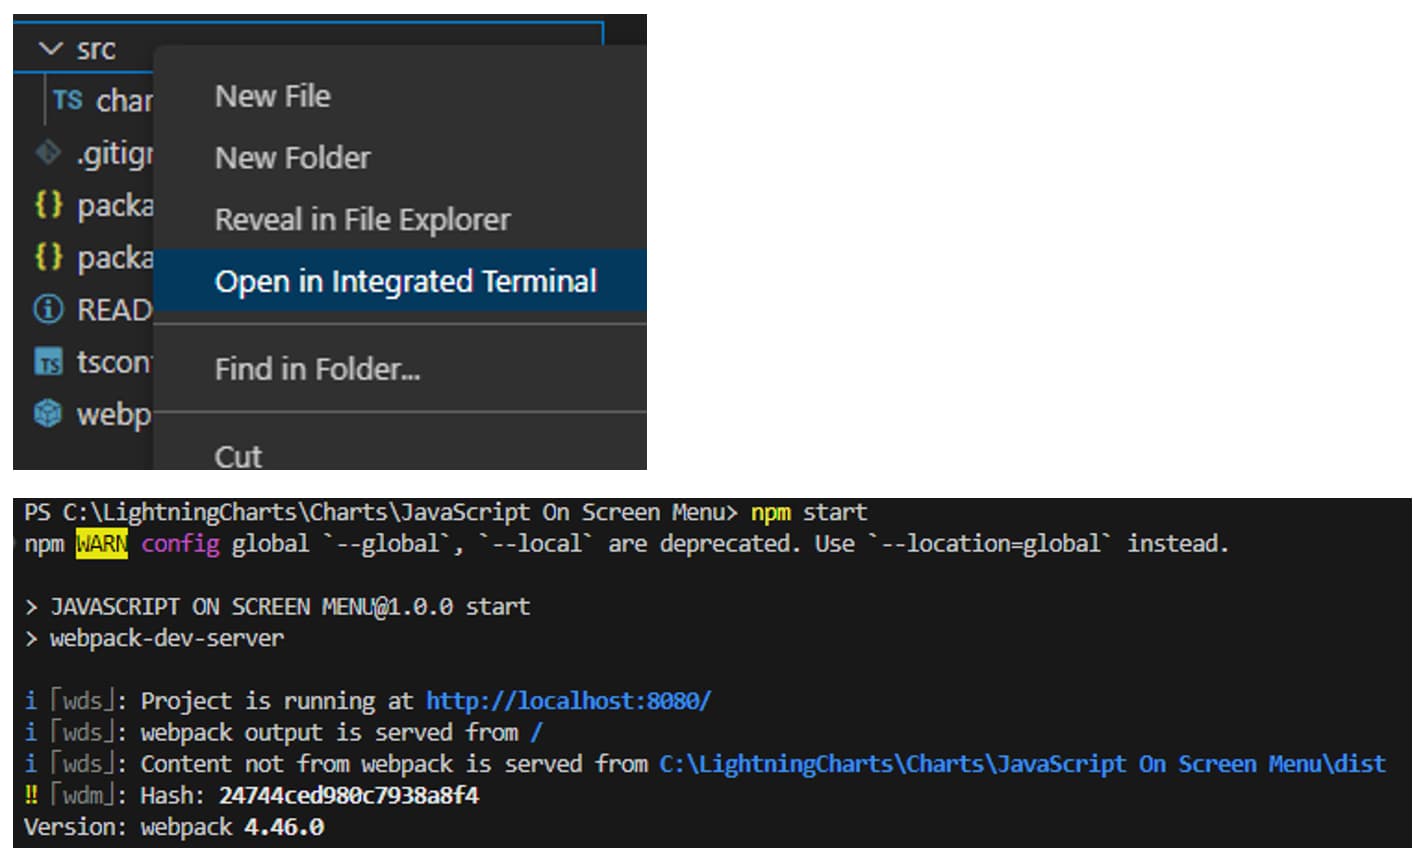
- After downloading the project template, you'll see a file tree like this one:
- Then open a new terminal and as usual in a Node JS project, run the
NPM Installcommand.
That'd be it, let's code.
CHART.ts
Inside the CHART.ts file, we will have all the logic needed to create our chart, configure animations, and format the data.
Start declaring the constant
lcjsthat will refer to our @arction/lcjs/xydata libraries:// Import LightningChartJS const lcjs = require('@arction/lcjs') // Import xydata const xydata = require('@arction/xydata')Now we have to extract the required classes from the lcjs constant:
 // Extract required parts from LightningChartJS.
 const { lightningChart, OnScreenMenuButtonType, OnScreenMenuButtonShape, ColorRGBA, SolidFill, PointShape, SolidLine, Themes } = lcjs

 const { createProgressiveTraceGenerator, createProgressiveRandomGenerator } = xydata
Now, before creating the dashboard object, make sure you have a license string but don't worry, get a non-commercial license (yes, is free for personal use and students). A license will allow you to run the project.
 let license = undefined
 try {
     license = 'xxxx-xxxx-xx-xxx-xxxx' // Put license string here
 } catch (e) {}
We will now create the
dashboardobject. Dashboard refers to a component for the flexible positioning of multiple charts in an efficient way.const dashboard = lightningChart({license: license}).Dashboard({ numberOfColumns: 1, numberOfRows: 3, theme: Themes.cyberSpace, })Upon its creation, the number of columns and rows needs to be specified. Charts and other components can then be placed in cells with given column and row locations and sizes (using methods of Dashboard, for example:
Dashboard.createChartXY.The Dashboard will distribute the available space for columns and rows which users can resize with mouse and touch interactions.
As for
Theme, it refers to the collection of default implementations that you can access by using the Themes property. The Color theme of components must be specified when it is created, and can’t be changed afterward (without destroying and recreating the component). All properties can be consulted in the Themes documentation.Now, let's add the XY chart to the dashboard. In this case,
getDefaultAxisXwill get the X axis and the location of this chart will be at the top of the dashboard (column/row index 0), and will use the total width of the dashboard (column span 1).const chart = dashboard.createChartXY({ columnIndex: 0, columnSpan: 1, rowIndex: 0, rowSpan: 2, }) const axisX = chart.getDefaultAxisX().setInterval({ start: 0, end: 100, })Let's now add the ZoomBand chart to the bottom of the dashboard (row index 2).
 const zoomBandChart = dashboard.createZoomBandChart({
     columnIndex: 0,
     rowIndex: 2,
 })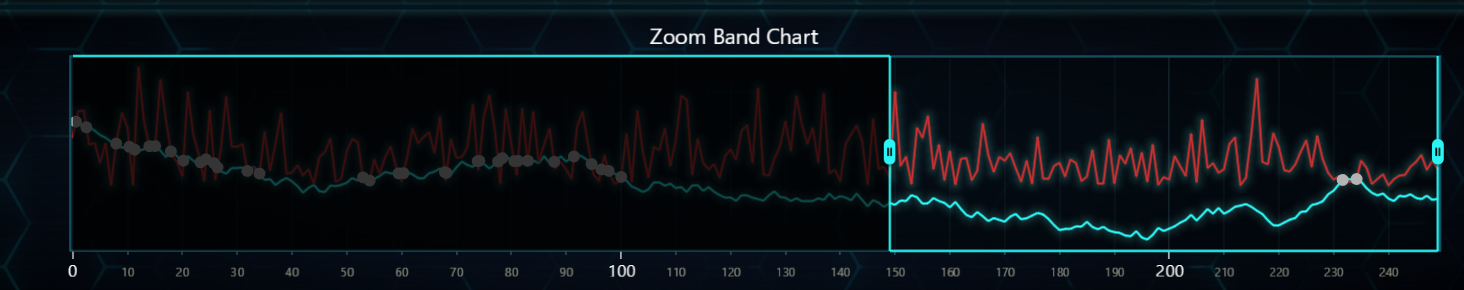
Adding a
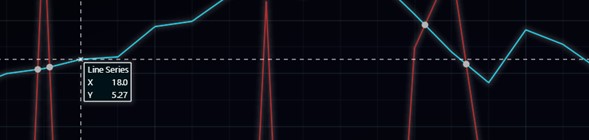
LineSerieschart to the chart assigned to the XY chart object. We have to store the object in a constant that will be used in the ZoomBand chart.// Add LineSeries to the XY Chart. const line = chart.addLineSeries() // Styles for 2nd LineSeries const customStrokeStyle = new SolidLine({ fillStyle: new SolidFill({ color: ColorRGBA(200, 50, 50) }), thickness: 2, }) // Add 2nd LineSeries to the XY Chart. const line2 = chart.addLineSeries().setStrokeStyle(customStrokeStyle)As for the properties,
SolidLinerefers to Instances of solid lines. All the style classes in LightningChart JS are immutable, meaning that its setters don't modify the actual object but instead return a completely new modified object.Some properties of SolidLine are
thicknessused to define the thickness of a line as pixels andfillStylefor defining a line fill color.Now we have to add a point series to the chart object.
 const point = chart
     .addPointSeries({ pointShape: PointShape.Circle })
     .setPointFillStyle(new SolidFill({ color: ColorRGBA(180, 180, 180) }))
     .setPointSize(10)
We can select between three shapes for the point (Circle, Triangle, Square). The size of points is measured in pixels and the point fill style is the same property that we used before in the line series.
Then copy the line series in the zoom bar chart:
 zoomBandChart.add(line)
 zoomBandChart.add(line2)
 zoomBandChart.add(point)
Creating random points and adding them to the line series. In this step, the generator is used to generate data for LightningChart JS. This creates a basic progressive random generator and uses the Stream API to output the data to the console.
 // Stream some random data.
 createProgressiveRandomGenerator()
     .setNumberOfPoints(250)
     .generate()
     .setStreamBatchSize(1)
     .setStreamInterval(50)
     .setStreamRepeat(false)
     .toStream()
     .forEach((point) => {
         const y = point.y * (Math.random() * 20) - 10
         line2.add({ x: point.x, y })
         // check intersection of line series
         getIntersection({ x: point.x, y })

         if (point.x > 50 && point.x < 200) {
             const oldInterval = axisX.getInterval()
             axisX.setInterval({
                 start: oldInterval.start + 1,
                 end: oldInterval.end + 1,
             })
         }
     })
When calling
.generate()on any data generator a new instance of a 'DataHost' is returned. The.generate()function can be called multiple times to get a new set of data with the same settings as before but different values each time.
On-Screen Menu
The dashboard is creating but we now need to add the on-screen menu which is the interesting part of this data application project. The main implementation for the menu is OnScreenMenu. This class handles the DOM creation, initialization, and event wiring of the core On-Screen Menu container.
// Add On-Screen menu
chart.addOnScreenMenu(
    [
        [
            // Default buttons
            OnScreenMenuButtonType.ZoomInX,
            OnScreenMenuButtonType.ZoomOutX,
            OnScreenMenuButtonType.ZoomInY,
            OnScreenMenuButtonType.ZoomOutY,
            OnScreenMenuButtonType.ZoomToFit,
            OnScreenMenuButtonType.ToggleAnimations,
            // Custom button
            {
                icon: 'https://lightningchart.com/js-charts/interactive-examples/examples/assets/0706/icon.png',
                dimensions: { rows: 1, columns: 1 },
                opacity: '0.8',
                color: 'blue',
                shape: OnScreenMenuButtonShape.RoundedRectangle,
                action: show,
            },
        ],
    ],
    OnScreenMenuButtonShape.RoundedRectangle,
)
We are implementing the available pre-defined buttons for increasing or decreasing the zoom in the specified axis for this menu. It is also possible to add custom buttons and the icon can be loaded from external sources.
The action property will refer to the show function and we can specify some behaviors for the menu before and after to show it in the dashboard.
// Function for actions of Custom On Screen Menu Button
function show() {
    if (!checked) {
        point.setVisible(false)
    } else {
        point.setVisible(true)
    }
    checked == false ? (checked = true) : (checked = false)
}
Using GetIntersection()
This method will be responsible for creating the intersection points between the two series of lines. When the bottom line touches or passes the top line, an intersection point will be created.
function getIntersection(currPoint) {
    // Index of last generated point
    const index = currPoint.x
    if (currPoint.x > 0) {
        // Check if lines were intersected
        if (
            (currPoint.y > arr1[index].y && prevPoint.y < arr1[index - 1].y) ||
            (currPoint.y < arr1[index].y && prevPoint.y > arr1[index - 1].y)
        ) {
            // Find point of intersection
            const interSectionPoint = calculateIntersection(currPoint, prevPoint, arr1[index], arr1[index - 1])
            point.add(interSectionPoint)
        }
        // Reassign curr point as prev. point
        prevPoint = currPoint
    } else {
        // Assign curr point as prev. point
        prevPoint = currPoint
    }
}
The points are for demonstration purposes and do not affect operation. The intersection points can serve as indicators in various subjects (mathematics, finance, etc.).
Note the formula that I use to calculate intersection points
$$Intersection point: (Px, Py)$$
$$(P_x = \frac{(x_1y_2 - y_1x_2)(x_3 - x_4) - (x_1 - x_2)(x_3y_4 - y_3x_4)}{(x_1 - x_2)(y_3 - y_4) - (y_1 - y_2)(x_3 - x_4)})$$
$$(P_y = \frac{(x_1y_2 - y_1x_2)(y_3 - y_4) - (y_1 - y_2)(x_3y_4 - y_3x_4)}{(x_1 - x_2)(y_3 - y_4) - (y_1 - y_2)(x_3 - x_4)})$$
NPM Start
To run the project and initialize the JavaScript on-menu charting application, you'll need to un the npm start command in the terminal. It will allow you to visualize the charting application on your local server.
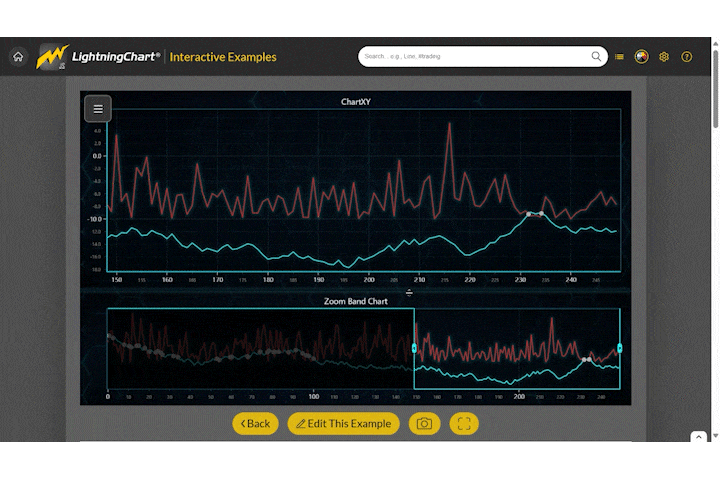
You can interact with the final application right from the interactive examples page.
Conclusion
If you're new to charting libraries, perhaps this wasn't the easiest example but I know that with the template provided, you will be able to recreate the project in a matter of few clicks if you don't want to code everything from scratch.
This was an example of a JavaScript dashboard that uses an 'add-on' On-Screen menu that simplifies the way how users interact with an application.
While is true that all LightningChart JS charting components support touchscreen interactivity, on-screen menus add great value for users who find UI elements more intuitive.
Developing the chart application is easy when using LCJS components as all classes and properties are already optimized and ready to be used where you will simply need to add your own customization.
Written by Omar Urbano
Got stuck and need help? Find me on LinkedIn


